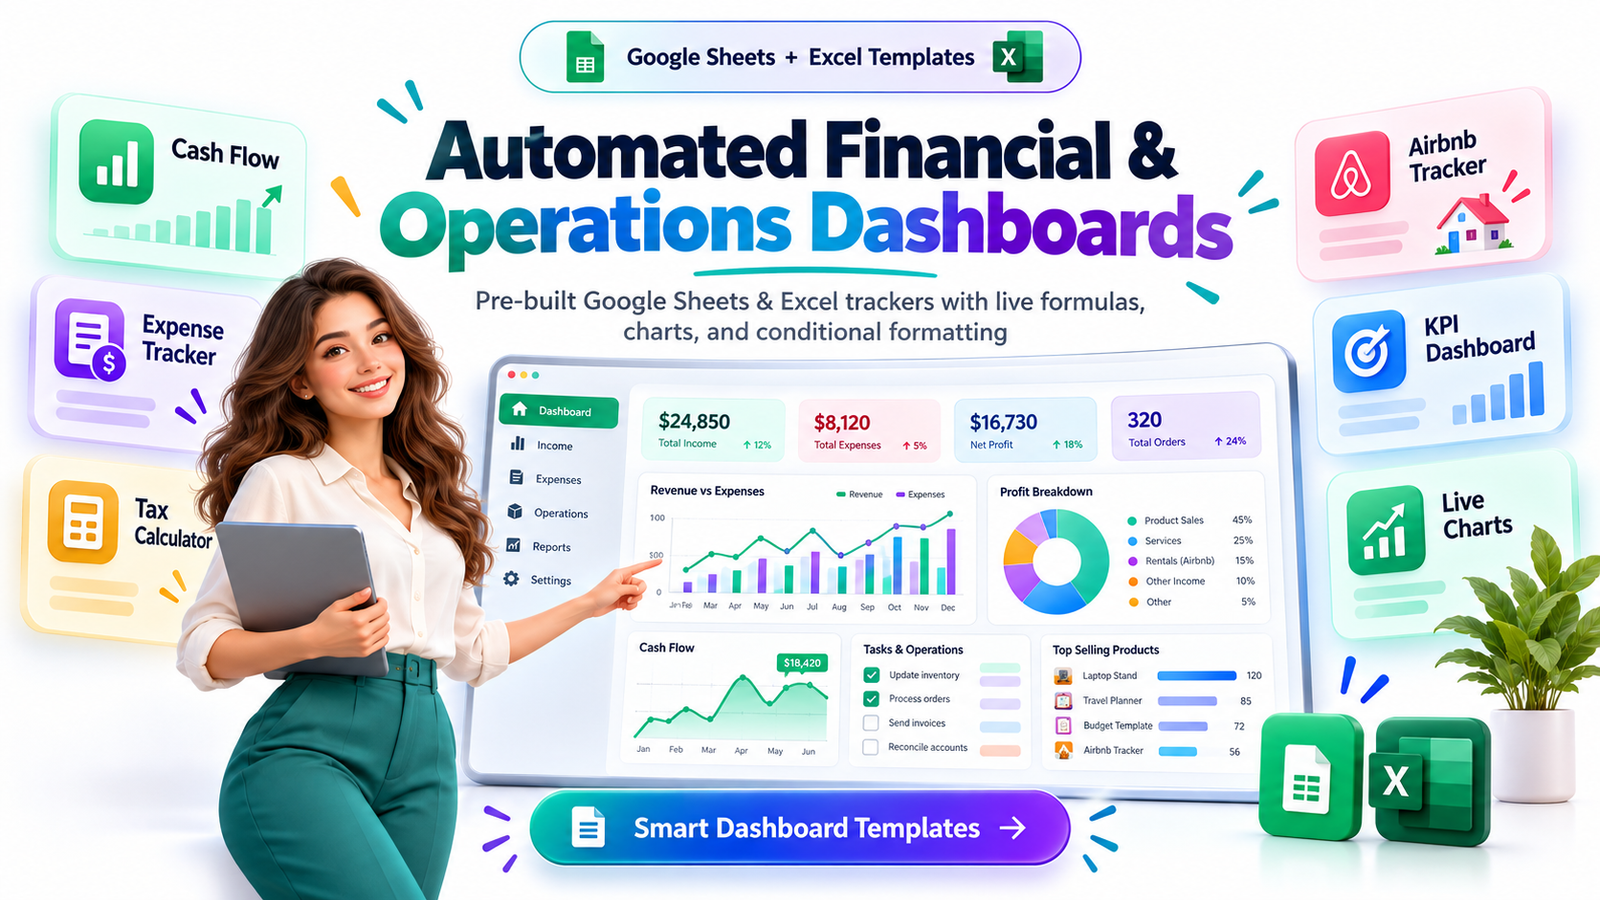
Learn how to build and sell automated Google Sheets and Excel financial dashboards with live formulas, charts, cash-flow tracking, KPIs, and niche-specific business automation.
Small businesses do not usually suffer from a shortage of data. They suffer from data scattered across invoices, bank statements, booking platforms, email receipts, payment processors, notebooks, and disconnected spreadsheets.
That creates an opportunity for digital product creators.
An automated financial and operations dashboard turns ordinary business data into a system that is easier to understand and act on. Instead of manually calculating monthly profit, tax reserves, occupancy rates, expenses, cash flow, or project profitability, a user enters a few numbers and lets formulas, charts, summaries, and conditional formatting do much of the repetitive work.
For a freelancer, that might mean a Google Sheets tax calculator that estimates income, deductible expenses, and money to reserve for taxes.
For an Airbnb host, it could mean a dashboard that tracks bookings, occupancy, cleaning costs, revenue per property, and monthly profit.
For a small business owner, it may be a cash-flow tracker showing expected income, upcoming expenses, monthly profit, and potential cash shortages.
These products can be created in Google Sheets or Microsoft Excel and sold as downloadable digital products through marketplaces such as Etsy, Gumroad, or Payhip.
The attractive part of this model is not merely that you are selling a spreadsheet. You are selling clarity, time savings, organization, and a repeatable decision-making system.
What Is an Automated Financial or Operations Dashboard?
An automated dashboard is a spreadsheet-based tool designed to transform raw information into useful business insights.
The word “automated” does not necessarily mean that the spreadsheet connects directly to a bank account or accounting platform. A well-designed template can feel highly automated simply because the calculations, summaries, charts, alerts, and reports update automatically whenever the customer enters new data.
For example, imagine a freelancer entering five payments and seven expenses into a transaction sheet.
The dashboard could automatically update:
Total monthly revenue
Business expenses
Estimated profit
Average project value
Tax reserve estimate
Outstanding invoices
Monthly revenue chart
Expense category breakdown
Year-to-date performance
This is far more useful than selling an attractive but mostly empty spreadsheet.
Customers are paying for the logic behind the template.
Why Spreadsheet Dashboards Can Become Valuable Digital Products
Digital spreadsheets occupy an interesting position between a simple printable and a specialized software application.
They can provide meaningful automation without requiring customers to learn complicated business software.
Many buyers already understand the basics of Excel or Google Sheets. That reduces the learning barrier.
A customer may not want to subscribe to another $30 or $50 monthly SaaS platform simply to understand cash flow, rental profitability, marketing expenses, or freelance income.
A one-time spreadsheet purchase can feel more accessible.
This creates opportunities around search terms and buyer needs such as:
Google Sheets dashboard template, Excel financial dashboard, small business cash flow spreadsheet, business expense tracker, freelance income tracker, Airbnb spreadsheet template, financial dashboard template, KPI tracker, profit and loss spreadsheet, operations dashboard, and freelance tax calculator.
The strongest products usually solve one clearly defined problem instead of trying to manage every aspect of someone’s business.
The Best Strategy: Build for a Specific Profession
A generic “Business Dashboard” may sound useful, but it competes with thousands of free spreadsheets and established business tools.
Specificity creates stronger commercial positioning.
Instead of:
Financial Tracker
consider:
Freelance Designer Income, Expense & Tax Dashboard
Instead of:
Rental Spreadsheet
consider:
Short-Term Rental Monthly Profit and Occupancy Dashboard
Instead of:
Business Expense Tracker
consider:
Mobile Food Business Daily Sales and Ingredient Cost Dashboard
A customer should immediately recognize that the spreadsheet was designed for someone like them.
This improves both conversion potential and long-tail search visibility.
Professions and Niches Worth Exploring
Potential dashboard markets include freelancers, consultants, photographers, content creators, Airbnb and vacation-rental hosts, cleaning businesses, home-service companies, wedding professionals, online coaches, Etsy sellers, digital-product creators, agencies, tutors, fitness professionals, event planners, mobile food businesses, small retailers, property managers, virtual assistants, photographers, and independent contractors.
Each audience has different metrics.
An Airbnb host cares about occupancy and nightly revenue.
A freelancer may care about project income and tax reserves.
An agency may want client profitability and recurring revenue.
A photographer may want booking deposits, package revenue, travel expenses, and outstanding balances.
That distinction is where your product becomes more useful.
Example Product: Freelance Financial Dashboard
Consider building a multi-tab Google Sheets template called:
Freelance Income, Expense & Tax Dashboard
The workbook could contain six interconnected sections.
Dashboard
This becomes the visual control center.
The customer sees important numbers immediately:
Monthly income
Year-to-date income
Total expenses
Estimated net profit
Invoices awaiting payment
Tax reserve
Average project value
Largest expense category
Monthly revenue trend
The dashboard should answer the buyer’s most important questions without requiring them to examine individual transactions.
Income Tracker
Customers record:
Date
Client
Project
Invoice number
Amount invoiced
Amount received
Payment method
Payment status
Due date
The dashboard can then separate paid income from outstanding invoices automatically.
Expense Tracker
Users record expenses such as software subscriptions, advertising, equipment, office costs, travel, education, contractors, internet expenses, and professional services.
Drop-down categories reduce typing errors and make category reporting easier.
Tax Estimate
A simple tax-planning tab can calculate an estimated reserve based on a percentage selected by the user.
For example, if the freelancer chooses a hypothetical 25% reserve rate and taxable profit is $4,000, the spreadsheet can display an estimated reserve of $1,000.
Tax rules differ significantly by jurisdiction and individual circumstances, so a commercial template should describe this as a planning estimate rather than professional tax advice.
Monthly Report
This sheet can automatically summarize January through December and display:
Revenue
Expenses
Profit
Profit margin
Estimated tax reserve
Outstanding income
The customer can quickly compare stronger and weaker months.
Setup and Instructions
Do not underestimate this tab.
A five-minute onboarding experience can determine whether the customer loves the product or becomes frustrated.
Explain exactly where users should type information, which cells contain formulas, how to duplicate the file, how categories work, and which cells should not be edited.
Build Automation Into the Template
The selling point of the product is not the number of tabs.
It is what happens automatically after the customer enters information.
Useful spreadsheet functionality can include SUMIFS, COUNTIFS, IF, IFERROR, FILTER, XLOOKUP, date functions, percentage calculations, data validation, pivot tables, dynamic charts, and conditional formatting.
Google Sheets users may also use tools such as QUERY when appropriate.
For example, conditional formatting could automatically make an overdue invoice visually prominent.
A revenue chart could expand as new monthly figures are entered.
A profit calculation could update instantly when a new expense is recorded.
A tax-reserve cell could recalculate whenever income or deductible expenses change.
The objective is simple:
Input once. Understand immediately.
That is the experience buyers are willing to pay for.
Use Conditional Formatting as a Decision Tool
Conditional formatting should communicate meaning rather than simply decorate the spreadsheet.
For example:
A negative monthly cash balance can receive a warning treatment.
An unpaid invoice approaching its due date can become more noticeable.
A monthly revenue target that has been reached can display a positive status.
An expense category exceeding its planned budget can trigger an alert.
The customer should be able to glance at the dashboard and understand what requires attention.
That makes the spreadsheet feel closer to lightweight business software.
Charts Should Answer Questions
More charts do not automatically create a better dashboard.
Every chart should help answer a business question.
A line chart might answer:
Is revenue increasing or decreasing?
A category chart might answer:
Where is most of my money going?
A monthly profit chart might answer:
Which months are most profitable?
An Airbnb occupancy chart might answer:
Which property or month has the strongest booking performance?
Avoid filling the dashboard with decorative graphs simply because Excel or Google Sheets makes them easy to create.
A clean dashboard with four meaningful visualizations will usually feel more professional than a crowded dashboard containing fifteen unnecessary charts.
Make the Template Difficult to Break
One of the hidden challenges of selling spreadsheet products is protecting customers from themselves.
People accidentally delete formulas.
They overwrite headings.
They paste data into the wrong columns.
They move charts.
They modify formatting.
Design around those mistakes.
Use clearly differentiated input areas, protected formula ranges where practical, data-validation menus, instructions, sample data, error handling, and an untouched backup/example tab.
Before selling the template, create a copy and deliberately try to break it.
Enter missing information.
Enter zeros.
Enter negative numbers.
Add unusually large amounts.
Leave dates blank.
Delete transactions.
Add hundreds of rows.
Test it on mobile.
Then fix every confusing result you encounter.
That testing process can create a substantially better product than spending another hour adjusting fonts.
Google Sheets vs. Excel: Which Should You Sell?
Both formats have commercial value.
Google Sheets works particularly well when customers want easy cloud access, automatic saving, browser-based use, and simple duplication.
Excel may appeal more strongly to customers already working in Microsoft Office environments or dealing with larger and more advanced workbooks.
One useful strategy is to create the original dashboard in one platform and eventually offer a compatible version for the other.
Do not simply assume formulas will behave identically.
Certain functions, chart behaviors, data-validation rules, and advanced features differ between Google Sheets and Excel.
Test both versions independently.
How to Deliver a Google Sheets Template
For a template product, customers generally should not edit your original master spreadsheet.
Keep a clean master copy.
Give purchasers access to a version they can copy into their own Google account rather than sharing editable access to your working master.
Include clear instructions explaining how customers make their own copy.
Your download package can also include a short PDF instruction guide containing the access link, setup instructions, feature explanations, license terms, troubleshooting tips, and support details.
That small addition can make the product feel significantly more professional.
What Makes a Spreadsheet Look Premium?
Premium spreadsheet design is mostly about restraint.
Start with readability.
Use a consistent type hierarchy.
Give tables enough spacing.
Keep input areas obvious.
Align numbers properly.
Use currency and percentage formats consistently.
Avoid unnecessary merged cells.
Keep important KPIs visible without excessive scrolling.
Make the dashboard usable on an ordinary laptop screen.
A customer buying a financial template primarily wants clarity.
Good design should make the numbers easier to understand rather than compete with them.
Add a Quick-Start Demo
A blank spreadsheet can intimidate buyers.
Consider supplying a demonstration version filled with fictional data.
For example, a freelancer dashboard could include several pretend clients, invoices, expenses, and monthly transactions.
The customer immediately sees how information flows through the workbook.
Then provide a second clean version for actual use.
This also gives you better material for screenshots, listing images, short videos, and product demonstrations.
Sell the Outcome, Not the Spreadsheet
Compare these two product messages.
“Google Sheets spreadsheet with seven tabs.”
Versus:
“See your freelance income, expenses, outstanding invoices, monthly profit, and estimated tax reserve from one dashboard.”
The second communicates an outcome.
Product listings should explain what the customer will be able to understand, organize, calculate, or decide after using the template.
Useful benefit-oriented phrases include:
Know where your money is going.
See your monthly profit without building formulas yourself.
Keep income, expenses, invoices, and tax planning in one place.
Spot cash-flow problems before the end of the month.
Turn scattered business numbers into a simple monthly dashboard.
The spreadsheet features support the sale.
The business outcome creates the desire to buy.
Pricing a Dashboard Template
A starter price of roughly $9-$19 can be practical for a focused template, especially while validating the niche.
However, pricing should reflect value and complexity rather than an arbitrary spreadsheet-template rule.
A simple single-purpose tracker may fit the lower end.
A polished multi-tab system with dashboards, instructions, automation, calculators, sample data, and multiple versions may justify a higher price.
You can also build a product ladder.
A basic edition handles one core task.
A professional edition adds reporting, forecasting, and additional dashboards.
A bundle could combine a cash-flow tracker, expense tracker, pricing calculator, annual planner, and invoice dashboard.
Increasing customer value is usually more sustainable than simply lowering the price.
Etsy, Gumroad, or Payhip?
Each platform can support a slightly different selling strategy.
Etsy can be useful when shoppers are already browsing for spreadsheet templates, business planners, financial trackers, and related digital products.
Gumroad can work well for creators who generate traffic through blogs, newsletters, social media, or their own audience.
Payhip can also support direct digital-product sales for creators who want their own storefront-style experience.
You do not necessarily need to choose only one permanently.
Start where you can learn fastest.
Track product views, conversion rate, customer questions, refunds, support requests, and frequently requested features.
Customer behavior often tells you what version to build next.
Turn Customer Questions Into Product Improvements
One overlooked growth strategy is using support questions as product research.
If several buyers ask:
“Can this track multiple properties?”
you may have discovered the need for an Airbnb portfolio edition.
If freelancers repeatedly ask:
“Can I track unpaid invoices?”
that feature deserves greater prominence.
If international buyers ask:
“Can I change the currency?”
make currency customization easier.
The best spreadsheet products can evolve because customers reveal where friction exists.
That also gives returning visitors a reason to revisit your store.
Create a Returning-Visitor System
Do not treat every template as an isolated product.
Build a small resource ecosystem around the same audience.
Suppose your primary audience is freelancers.
Your site might eventually include:
A freelance financial dashboard
A freelance pricing calculator
A client profitability tracker
A quarterly business review template
A project time-and-profit calculator
An invoice follow-up tracker
A yearly business planning dashboard
Someone finding your tax spreadsheet through search today may return later for another business tool.
Within your article, invite readers to bookmark the guide and return when you release new dashboard examples, formula walkthroughs, spreadsheet templates, and niche-specific versions.
That creates a stronger relationship than chasing a one-time click.
Search Intent Matters More Than Keyword Volume Alone
The strongest SEO strategy begins with understanding what the searcher is trying to accomplish.
Someone searching:
what is a financial dashboard
is primarily learning.
Someone searching:
how to create a small business cash flow dashboard in Google Sheets
wants instructions.
Someone searching:
best small business cash flow spreadsheet template
may be evaluating products.
Someone searching:
Google Sheets Airbnb tracker template
may have direct purchase intent.
Your content can support several stages of this journey while keeping one clear primary subject.
Natural semantic terminology may include cash-flow tracking, profit monitoring, revenue dashboard, expense management, KPI reporting, financial planning, spreadsheet automation, small-business reporting, operational metrics, monthly business dashboard, financial template, Excel dashboard, and Google Sheets business template.
Use these terms where they genuinely improve the explanation rather than repeating them mechanically.
AEO and GEO: Make Important Answers Easy to Understand
Answer-engine and AI-search visibility still depends heavily on publishing information that is useful, clear, original, and trustworthy.
Google’s current guidance for generative AI search specifically emphasizes valuable, non-commodity, people-first material rather than relying on supposed “GEO hacks.”
That means concise definitions matter.
For example:
What is an automated financial dashboard?
An automated financial dashboard is a spreadsheet or software interface that converts financial inputs such as revenue, expenses, invoices, and budgets into automatically updated calculations, KPIs, charts, and alerts.
A direct answer like that works for readers while also making the page easier for search and answer systems to interpret.
Follow the concise answer with deeper explanation, examples, limitations, and practical experience.
Google Discover: Build for Interest, Not Clickbait
There is no formula that guarantees a page will appear in Google Discover.
Google’s February 2026 Discover update emphasized more original, in-depth, timely material from sources demonstrating subject expertise while reducing sensational and clickbait-oriented content.
That makes a title such as:
How to Build an Automated Financial Dashboard in Google Sheets
more sustainable than:
This Secret Spreadsheet Will Make You Rich Overnight
The article should deliver exactly what its headline promises.
Use original screenshots where possible.
Demonstrate an actual dashboard.
Explain your formulas.
Show before-and-after examples.
Discuss mistakes.
Provide downloadable examples or supporting resources when appropriate.
Those elements provide evidence of real effort and expertise instead of producing another generic summary.
Google’s people-first content guidance similarly emphasizes originality, useful depth, clear authorship, accuracy, first-hand experience, and satisfying the visitor’s actual goal.
Use a Strong Featured Image
Your featured image should visually communicate the subject within seconds.
A good concept would show a modern laptop displaying an attractive financial dashboard, several clearly recognizable spreadsheet charts, subtle finance and operations icons, and a clean professional workspace.
Avoid misleading screenshots or irrelevant generic stock photography.
For Discover, Google currently recommends relevant, compelling large images that are at least 1200 pixels wide, high resolution, and enabled for large image previews. Google also notes that schema.org markup and og:image can help specify the preferred representative image.
A 16:9 featured image works especially well for editorial presentation, while additional 4:3 and 1:1 versions can support different surfaces.
Use Article or BlogPosting Structured Data
For an educational article like this one, Article or BlogPosting structured data can help search engines understand information including the headline, author, publication date, and representative images.
Google currently recommends providing representative high-resolution imagery and supports multiple image aspect ratios, including 16:9, 4:3, and 1:1.
Structured data does not create a ranking guarantee.
It provides clearer machine-readable information about the page.
Your visible page still needs to deliver genuine value.
Financial Content Requires Extra Care
A spreadsheet that tracks money can influence real financial decisions.
Treat formulas carefully.
Test calculations using multiple scenarios.
Clearly distinguish bookkeeping tools from professional accounting advice.
If you include tax calculations, state which assumptions are being made.
Avoid claiming that a universal spreadsheet determines someone’s exact tax obligation.
Encourage customers to confirm important tax and accounting decisions with appropriate professionals in their jurisdiction.
This does not make the product weaker.
It makes it more trustworthy.
Google’s quality guidance gives particularly high importance to trust and accuracy for topics that can materially affect a person’s financial stability.
From One Template to a Digital Product Business
Your first spreadsheet does not need to become a giant financial-management system.
It needs to solve one problem exceptionally well.
Choose one profession.
Identify the numbers that profession regularly needs to understand.
Build a clean input system.
Automate the calculations.
Create a useful dashboard.
Test the template with realistic scenarios.
Document every step.
Then package it as a professional digital product.
A freelancer may open the dashboard every Friday.
An Airbnb host may review it after every booking cycle.
A small-business owner may use it at the end of every month.
That repeated usefulness is what separates a forgettable download from a valuable business tool.
The opportunity is not simply “selling spreadsheets.”
It is creating small operational systems for people who want the benefits of automation without the complexity of enterprise software.
A Simple Product Launch Approach
Begin with one narrow template rather than ten unfinished products.
For example, create a Freelance Income, Expense & Tax Dashboard.
Populate it with fictional demonstration data.
Test every formula.
Create a clean customer version.
Prepare several screenshots showing the dashboard, transaction tracker, reports, and automated calculations.
Write a listing focused on the customer’s problem.
Offer it within an introductory range such as $9-$19 if that fits your positioning.
Collect legitimate customer feedback.
Improve confusing sections.
Then expand into related products based on what customers actually request.
This approach turns product development into a learning cycle rather than guessing which dashboard somebody might buy.
Frequently Asked Questions
1. What is an automated financial dashboard template?
An automated financial dashboard template is a pre-built spreadsheet that converts user-entered financial information into automatically updated calculations, metrics, summaries, alerts, and charts. Common examples include cash-flow dashboards, expense trackers, freelance income trackers, rental-property dashboards, and profit-and-loss trackers.
2. Can I sell Google Sheets templates on Etsy, Gumroad, or Payhip?
Digital spreadsheet templates can be sold through digital-product marketplaces when they comply with the platform’s current policies and you have the necessary rights to the content, formulas, design elements, and included assets. Keep your original master protected and provide customers with clear instructions for accessing or copying their own version.
3. What should be included in a small-business financial dashboard?
A practical small-business dashboard may include revenue, expenses, profit, cash flow, accounts receivable, monthly trends, budget comparisons, expense categories, and selected operational KPIs. The correct metrics depend on the type of business rather than on how many statistics can fit on one page.
4. Do I need advanced Excel skills to create spreadsheet products?
Not necessarily. A useful first product can be built using formulas such as SUMIFS, COUNTIFS, IF, IFERROR, data validation, conditional formatting, and basic charts. More advanced formulas and reporting features can be added as the product becomes more sophisticated. Accuracy and ease of use are more important than unnecessary technical complexity.
5. How can I make a financial spreadsheet template more valuable?
Make the spreadsheet solve a specific problem for a clearly defined audience. Add automated calculations, useful charts, sensible conditional formatting, clean data-entry areas, instructions, realistic demonstration data, error handling, and thoughtful reporting. A template becomes more valuable when it reduces repetitive work and helps the customer make a decision more quickly.
Build the Dashboard People Open Every Week
A profitable spreadsheet template does not have to be complicated.
It has to be useful.
The strongest automated financial and operations dashboards take information that feels disorganized and transform it into answers:
How much did I earn?
Where did the money go?
Which clients still owe me?
Did this property make a profit?
Am I staying within budget?
What should I pay attention to this month?
If your template can answer those questions accurately, quickly, and clearly, you are creating more than another downloadable file.
You are creating a small business system.
Start with one audience, one recurring problem, and one well-built dashboard. Make it simple enough to use regularly and useful enough that customers are glad they purchased it.
Then let customer questions guide what you build next.
#Bookmark this guide and return as you develop your dashboard library. New niche ideas, automation methods, spreadsheet formulas, product-positioning strategies, and dashboard concepts can turn one useful template into an expanding digital-product collection.
#Automated financial dashboard template
#Google Sheets dashboard template, Excel financial dashboard, small business cash flow spreadsheet, operations dashboard template, financial spreadsheet template, business KPI tracker, freelance income tracker, expense tracker spreadsheet, automated spreadsheet dashboard, cash flow tracker, freelance tax calculator, Airbnb spreadsheet template.
Stay ahead with exclusive updates
Join our community. Get curated industry trends, actionable guides, and fresh resources delivered straight to your inbox.